


Every Tuesday I apply the PULSE framework to a new stock to illustrate the process. The framework combines 5 fundamental signals across all 3 financial statements to quickly place a stock into one of 3 categories:
Not interesting
Attractive company at a high price that maybe interesting later
Attractive company at an interesting price
This isn't a stock recommendation system. It's a triage tool - designed to answer one question before you spend hours on research: is this worth a deeper look now?
Let’s get to Super Micro Computer ($SMCI) and put it through the PULSE framework to see if it's worth more research.
The “P” stands for Economic Profit, and here is what SMCI’s looks like:
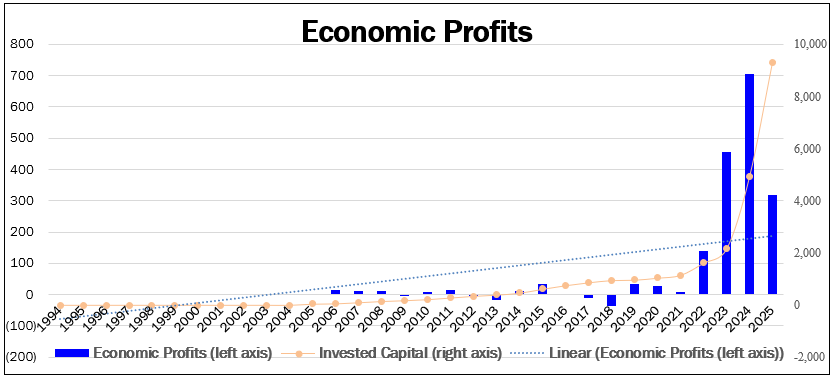
The chart is attractive - it has positive, rising Economic Profits over a long period of time
The “U” stands for Underlying FCF, and here is what SMCI’s looks like:
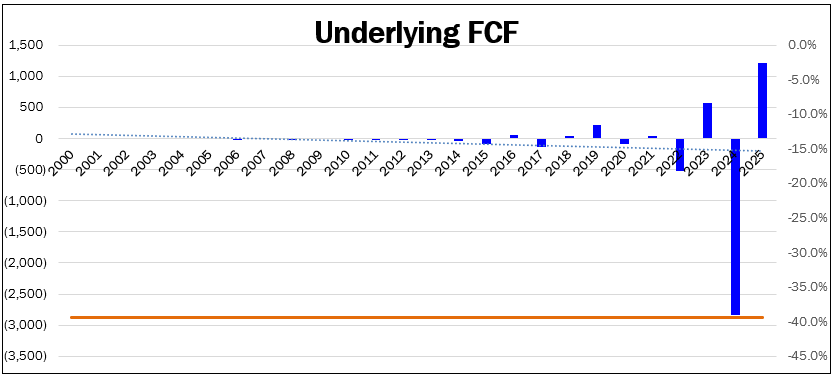
Underlying FCF is inconsistent, positive in some years and negative in others
This could be because of growth investments which are not backed out of CapEx. Given the growth in Invested Capital in our Economic Profit chart combined with rapidly increasing Economic Profits, it would be reasonable to give the company the benefit of the doubt
The “L” stands for Financial Leverage, here is what SMCI’s looks like:
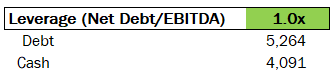
Leverage looks modest, suggesting the balance sheet is in good shape.
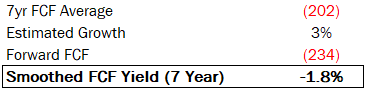
The “S” stands for Smoothed Underlying FCF yield, here is what SMCI’s looks like:
Note that the goal is to be approximately correct, not precise. We are screening here to decide if the stock is worth doing more work on, so it’s OK to be a bit off.
For SMCI, the FCF yield is negative, which is obviously unattractive at face value. However, as mentioned before we would want to dig deeper into maintenance vs. growth capex to understand what the true FCF is.
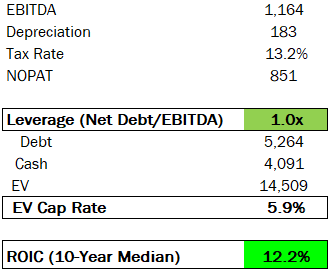
The “E” stands for EV Cap Rate, which for SMCI is:
The EV Cap Rate is a nice complement to the Smoothed FCF yield for two reasons:
The EV Cap Rate is based on the more recent last 12 month profits
It looks at the whole capital structure, not just the equity
For SMCI, the 6% EV Cap Rate is middle of the road.
Putting It All Together
Let’s put all 5 PULSE signals together for SMCI:
Economic Profits: Excellent
Underlying FCF: Questionable
Leverage: Good
Smoothed Underlying FCF Yield: Questionable
EV Cap Rate: Neutral
Conclusion: Based on the PULSE framework, SMCI is a pass.
Do you want to get the PULSE template so that you can save many hours screening stocks and focus on the highest-potential opportunities? You can get it here.
Every Friday I plan to publish a video post going through 3-4 stocks with the PULSE framework. The posts will be free, but only paid subscribers can request which stocks I look at. If you are a paid subscriber, please leave a comment with your request, post it in the PULSE chat or send me a DM.
Disclaimer: Not financial advice, for educational purposes only.
About the author

Gary Mishuris, CFA is the Managing Partner and Chief Investment Officer of Silver Ring Value Partners, an investment firm that seeks to apply its intrinsic value approach to safely compound capital over the long-term. He also teaches the Value Investing Seminar at the F.W. Olin Graduate School of Business.
Nice pulse check. I bought smci shares 5 years ago when no one knew about it and before it went up 3,624%! Actually i published an article 3 days ago talking about what I learnt with it. Feel free to check it out if interested!
It doesn’t price in the governance issues and risk of the few big customers it has defecting?