



I have launched a series applying the PULSE framework to a new stock each week to illustrate the process. If you are not familiar with the framework, you can watch this video on my newly re-launched YouTube channel.
The PULSE framework combines 5 fundamental signals across all 3 financial statements to quickly place a stock into one of 3 categories:
Not interesting
Attractive company at a high price that maybe interesting later
Attractive company at an interesting price
This isn't a stock recommendation system. It's a triage tool - designed to answer one question before you spend hours on research: is this worth a deeper look now?
Let’s get to Lululemon ($LULU) and put it through the PULSE framework to see if it's worth more research.
The “P” stands for Economic Profit, and here is what Lululemon’s looks like:
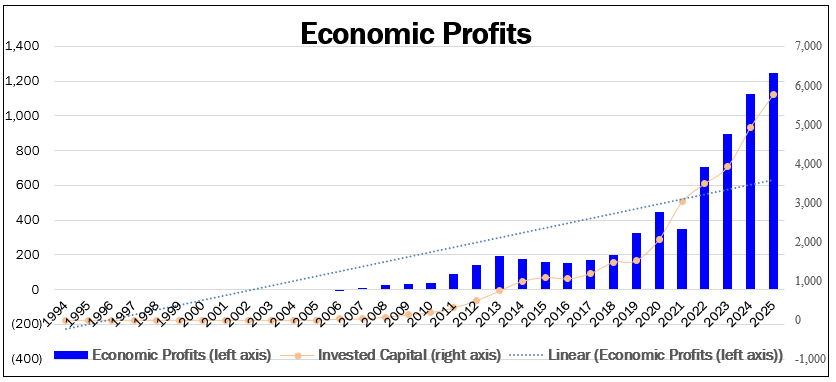
The chart is very attractive - it has positive, rising Economic Profits over a long period of time
The “U” stands for Underlying FCF, and here is what Lululemon’s looks like:
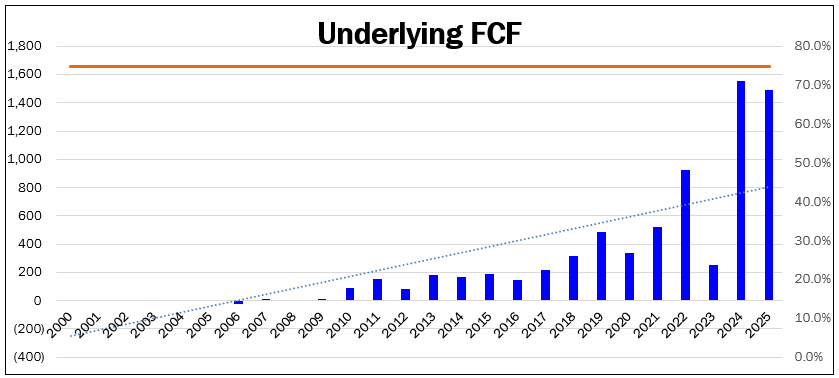
It’s an attractive chart with positive and rising FCFs
The ratio between FCF and Net Income over the last decade is above 70%, which is reasonable for a company that has had rapid growth over the last decade
The “L” stands for Financial Leverage, here is what Lululemon’s looks like:
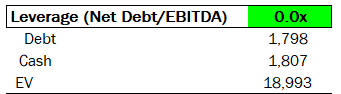
There is almost no Net Debt, so that’s excellent. One thing I would investigate for any company that has retail stores is whether it owns or leases them, as rent expense can be thought of as a form of debt service. In that case, I would look at Adjusted Debt/EBITDAR instead of just Debt/EBITDA.
The “S” stands for Smoothed Underlying FCF yield, here is what Lululemon’s looks like:
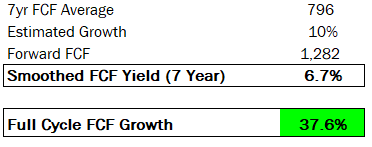
Note that the goal is to be approximately correct, not precise. We are screening here to decide if the stock is worth doing more work on, so it’s OK to be a bit off.
For Lululemon, the ~7% FCF yield is attractive. That is in the context of (1) a high-ROIC company and (2) a company with high historical growth. Clearly 7% in, and of, itself is not dirt-cheap, and for a business with low/negative growth and poor returns it would not be attractive.
The “E” stands for EV Cap Rate, which for Lululemon is:
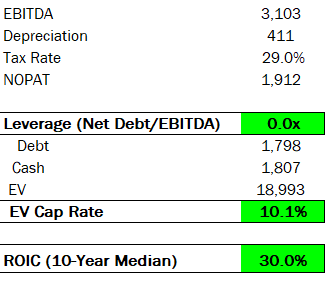
The EV Cap Rate is a nice complement to the Smoothed FCF yield for two reasons:
The EV Cap Rate is based on the more recent last 12 month profits
It looks at the whole capital structure, not just the equity
For Lululemon, the 10% EV Cap Rate is very attractive.
Putting It All Together
Let’s put all 5 PULSE signals together for Lululemon:
Economic Profits: Excellent
Underlying FCF: Excellent
Leverage: Excellent
Smoothed Underlying FCF Yield: Attractive
EV Cap Rate: Very Attractive
Conclusion: Based on the PULSE framework, Lululemon is interesting and deserves further research.
Do you want to get the PULSE template so that you can save many hours screening stocks and focus on the highest-potential opportunities? You can get it here.
Every Friday I plan to publish a video post going through 3-4 stocks with the PULSE framework. The posts will be free, but only paid subscribers can request which stocks I look at.
Disclaimer: Not financial advice, for educational purposes only.
About the author

Gary Mishuris, CFA is the Managing Partner and Chief Investment Officer of Silver Ring Value Partners, an investment firm that seeks to apply its intrinsic value approach to safely compound capital over the long-term. He also teaches the Value Investing Seminar at the F.W. Olin Graduate School of Business.