


I have launched a series applying the PULSE framework to a new stock each week to illustrate the process. If you are not familiar with the framework, you can watch this video on my newly re-launched YouTube channel.
The PULSE framework combines 5 fundamental signals across all 3 financial statements to quickly place a stock into one of 3 categories:
Not interesting
Attractive company at a high price that maybe interesting later
Attractive company at an interesting price
This isn't a stock recommendation system. It's a triage tool - designed to answer one question before you spend hours on research: is this worth a deeper look now?
Let’s get to Apple ($AAPL) and put it through the PULSE framework to see if it's worth more research.
The “P” stands for Economic Profit, and here is what Apple’s looks like:
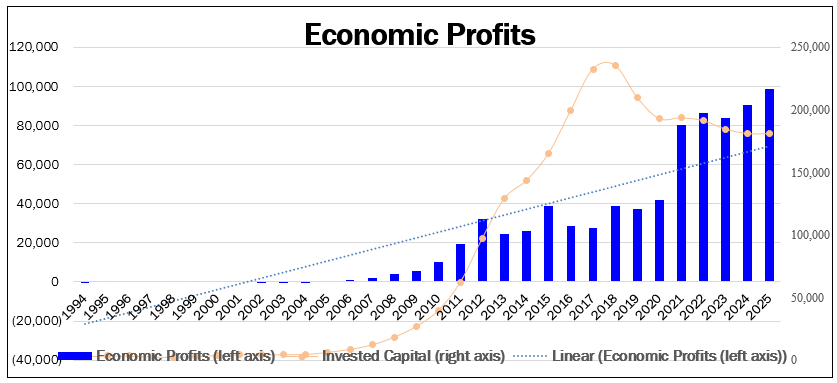
The chart is very attractive - it has positive, rising Economic Profits over a long period of time
The “U” stands for Underlying FCF, and here is what Apple’s looks like:
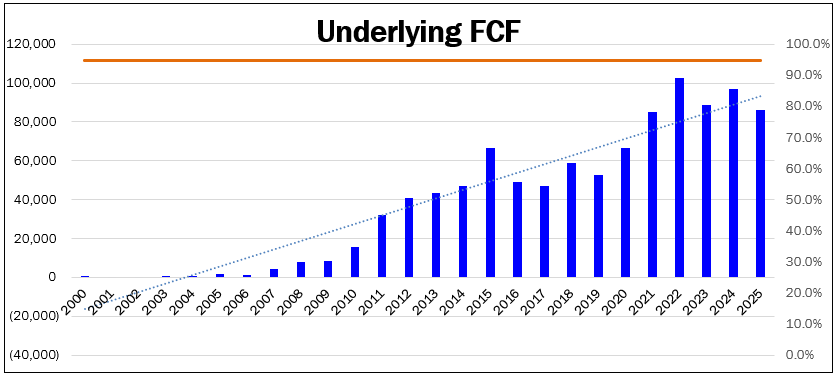
It’s a very attractive chart with positive and rising FCFs
The ratio between FCF and Net Income over the last decade is close to 100%, which is excellent
The “L” stands for Financial Leverage, here is what Apple’s looks like:
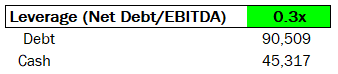
There is almost no Net Debt, so that’s excellent as well.
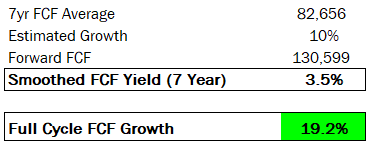
The “S” stands for Smoothed Underlying FCF yield, here is what Apple’s looks like:
Note that the goal is to be approximately correct, not precise. We are screening here to decide if the stock is worth doing more work on, so it’s OK to be a bit off.
For Apple, the 3.5% FCF yield is not attractive. It implies high expectations for future growth. Those might, or might not, be met, but it doesn’t stand out as interesting.
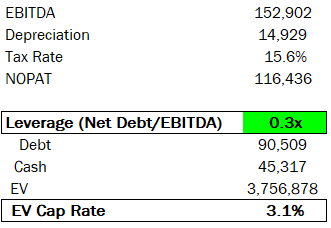
The “E” stands for EV Cap Rate, which for Apple is:
The EV Cap Rate is a nice complement to the Smoothed FCF yield for two reasons:
The EV Cap Rate is based on the more recent last 12 month profits
It looks at the whole capital structure, not just the equity
For Apple, the 3% EV Cap Rate is also low (meaning high expectations about the future) and not particularly interesting.
Putting It All Together
Let’s put all 5 PULSE signals together for Apple:
Economic Profits: Excellent
Underlying FCF: Excellent
Leverage: Excellent
Smoothed Underlying FCF Yield: High expectations / not interesting
EV Cap Rate: High expectations / not interesting
Conclusion: Based on the PULSE framework, Apple falls in the category of good company but not interesting at the current price for me. Given its size, high expectations about future growth are going to be much harder to achieve than the same growth rate in the past from a much smaller base. In investing, you are most rewarded for answering easy questions and this one isn’t one of them right now.
Do you want to get the PULSE template so that you can save many hours screening stocks and focus on the highest-potential opportunities? You can get it here.
What if you could pick the next stock I run through PULSE? Next week, I'm opening that up. Details coming.
Disclaimer: Not financial advice, for educational purposes only.
About the author

Gary Mishuris, CFA is the Managing Partner and Chief Investment Officer of Silver Ring Value Partners, an investment firm that seeks to apply its intrinsic value approach to safely compound capital over the long-term. He also teaches the Value Investing Seminar at the F.W. Olin Graduate School of Business.
Thanks for sharing - interesting framework that covers the core pain points of fundamental analysis - capital efficiency, cash generation potential, balance sheet strength and valuation. To my understanding valuation is mainly based on FCF yield and EV cap rate, are these metrics adjusted for growth or financial health to determine if the valuation level is attractive?
Thanks Gary. I find these examples of the PULSE framework very helpful in the learning. Based on your experience, would you have a range for each factor that helps us classify them? For example, at what point, the EP goes from bad to good to excellent. In a previous post, you noted Leverage of +3.5 has a 'watch-out'. Thank you