



(Note: If you are just joining the seminar, please start by reading the Introduction)
When I was just starting out as an investor, 25 years ago, I used to think that if a stock traded below book value it was probably a bargain. How things have changed.
The reality is that even back in Benjamin Graham’s days, a stock trading below book value was an invitation to do further work, not a sure-fire sign of an undervalued security. After all, remember that book value is just the historical amount of equity capital that went into the business. It tells you little about what that business is now worth under its current competitive reality.
Investors who have only come across Graham’s work superficially typically know him for his “net-nets.” Hopefully if you have read Parts 1 through 5 and answered the questions in this seminar, you know by now that there is a lot more to Graham than that.
However, even Graham’s “net-nets” are frequently misunderstood. People want to make them into a mechanical, formulaic calculation that is black and white. That is not the case. Reality is more complicated than that.
When you look at Graham’s suggested table for calculating liquidation value below, did you understand a) why these balance sheet items need a discount b) why the discount is increasing as you go down the table and c) why the range is getting wider?
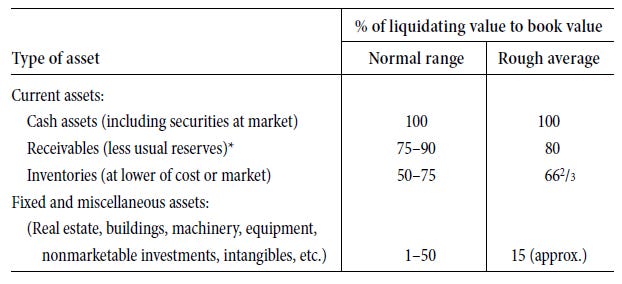
Source: Security Analysis, Benjamin Graham, 6th Ed, Pg. 560
Pause for a minute and try to answer those questions.
If you had trouble, consider different business types that might be undergoing a liquidation. For example, what would demand a bigger haircut: the inventory of a teenage apparel retailer that ran into trouble, or a seller of gold coins?
Or if you are considering the discount applicable to Property, Plant & Equipment, think about whether a greater discount would need to be applied to PP&E that has many alternative uses as opposed to highly specialized equipment?
Even though this is what Graham is most known for, and most investors treat this as a purely quantitative calculation, I hope that by now you appreciate how much qualitative judgement is still involved. Never let formulas replace a fundamental understanding of the business, whether you are following Graham’s approach or a completely different one.
Regarding Question 1 John wrote: “Ideally, book value anchors valuation in fact, not forecast. It measures the tangible capital behind a share and (should) offer a margin of safety when prices fall below that base. However, by the time you see a book value, it’s already old and dated - it captures the past, not earning power. A business is worth what its assets can produce in the future, not just what they cost in the past. At best, book value protects the investor by giving them a valuation floor, but it rarely tells the whole story”
Regarding Question 2 Navin wrote “Graham emphasizes that even if book value is often not a determining factor, it deserves “at least a fleeting glance” before buying or selling. This aligns with the margin of safety principle: assets provide a cushion against downside risk.
Today, it’s appearing less central but still valuable as a reality check in asset-heavy or distressed contexts.”
Regarding Question 3 PatrickL wrote: “Graham’s liquidation process is basically a very conservative mark-to-reality exercise. He takes the balance sheet and applies heavy haircuts to most asset categories. Cash stays at full value. Receivables get discounted. Inventory is marked down a lot. Other current assets get cut in half. Fixed assets are marked way down because they usually don’t sell anywhere close to book value in a forced situation. Intangibles are left out. Then he subtracts all liabilities. The goal is simply to make sure the investor is protected even if things go badly.”
Regarding Question 5 James wrote: “Many, many, many:
1) liquidation estimate of value too high: sometimes things are sold for a song, far lower than expected, or seems reasonable: even assets that are very tangible, like property, can realise far less than expected.
2) It can take a very long time to liquidate a complex company. LCTM which went bust in 1998 took decades to liquidate, and I once received a check from a supplier who had gone bust nearly 30 years previously, and had a land asset that was eventually sold.
3) Dilution, capital raises, or sale of the whole for very little.
4) Expenses of liquidation can eat up the margin of safety. Legal fees, liquidators fees, surveyors fees, banking fees, and the listing fees, are all substantial, and accumulate over the often protracted process.”
Regarding Question 6 J. Rupert wrote: “Alignment of interest is uber important because their actions and recommendations directly influence the chance of recovery. Will management address inefficient or overly aggressive use of assets that may have increased earnings? Will they consider new ownership or mergers to optimize asset utilization? If all else fails, would they accept reality and liquidate, prioritizing the financial well-being of debt and equity holders, even at the loss of their own jobs? If there is trust in the management to make these potentially unpopular decisions, they may not be depended on to assist in the turnaround.”
Week 7 assignment is to read Part 7 of Security Analysis and answer the following questions:
Question 1: How does Graham suggest we approach comparing companies in the same field?
Question 2: What are some limitations/pitfalls of such comparisons?
Question 3: How does Graham suggest we go about uncovering investment opportunities? How would you adapt his approach to the current environment?
Question 4: Where is Graham’s approach located on the different “dimensions” of an investment style? Try to find as many dimensions as you can and think about where Graham is on each. Use a scale of 1 to 10 and indicate what each extreme means for each dimension. Then think about where you would like to be on each (and why). If you need inspiration for dimensions, read this article.
Question 5: What is your overall assessment of Graham’s investment approach? Which aspects of it would you like to incorporate into your own? What changes do you want to make? Why?
Question 6: Find one security of any kind that you think that Graham would conclude currently has a large margin of safety based on his approach outlined in Security Analysis. Please provide a brief qualitative and quantitative analysis supporting your view that Graham would be proud of.
Note: Our next reading will be Philip Fisher’s Common Stocks and Uncommon Profits.
Now it’s your turn:
Submit your answers in the comments below this article with all your answers in a single comment. I will engage with some of the answers each week and highlight some of the ones I find most insightful in next week’s seminar assignment article.
Engage with the answers of some of your fellow seminar members in the comments below. Remember – the goal is to learn together. Be kind, be respectful and try to add to our learning as a community.
Feel free to ask any questions about the reading in your comment.
Until next week,
Gary
About the author

Gary Mishuris, CFA is the Managing Partner and Chief Investment Officer of Silver Ring Value Partners, an investment firm that seeks to apply its intrinsic value approach to safely compound capital over the long-term. He also teaches the Value Investing Seminar at the F.W. Olin Graduate School of Business.
Question 1:
Graham suggests that when comparing companies in the same field, the best approach is to line up the basic financial numbers side by side over a long period. He wants the analyst to look at earnings records, balance sheet strength, capital structure, and consistency. The point is not to forecast the future but to understand which companies are truly stronger and more stable based on actual history. Graham prefers long-term averages rather than one-year snapshots because short-term results can be misleading.
Question 2:
There are several limitations to these comparisons. Companies might use different accounting methods, which can distort the numbers. One company might look more profitable simply because it uses more leverage. Cyclical industries can make weak companies look good at the top of the cycle and strong companies look weak at the bottom. Some businesses also have unique risks or strengths that do not show up in high-level comparisons. For these reasons, Graham warns that comparisons are helpful but must be used carefully.
Question 3:
Graham recommends uncovering opportunities by doing broad and steady reading. This includes going through company lists, financial statements, and industry summaries, and watching for unusual price behavior or neglected companies. He believes bargains rarely appear in popular companies. In today’s environment, I would still follow this approach but combine it with modern tools like stock screeners, databases, and AI systems to help surface unusual patterns or overlooked names more efficiently. The core idea remains the same: keep looking widely, then narrow in.
Question 4:
Here are some investing dimensions and where I think Graham sits on each, along with where I would place myself.
Time horizon
1 means short term and 10 means very long term
Graham is around 9
I would also be around 9 because I do not want to trade often.
Valuation strictness
1 is loose and 10 is extremely strict
Graham is a 10
I would be an 8 to allow more flexibility for businesses with intangible strengths.
Use of forecasting
1 is heavy forecasting and 10 is almost none
Graham is about a 9
I would be around 7 because today’s world sometimes requires some forecasting.
Risk tolerance
1 is high risk and 10 is very low risk
Graham is a 9
I am probably a 7 because some modern opportunities require selective risk taking.
Balance sheet focus
1 is minimal and 10 is heavy focus
Graham is a 10
I am roughly an 8 since I still value balance sheets but also consider competitive advantages.
Quantitative emphasis
1 is mostly qualitative and 10 is mostly quantitative
Graham is about an 8
I am closer to a 6 because I think qualitative analysis has grown in importance.
Diversification
1 is very concentrated and 10 is highly diversified
Graham is around 8
I would be an 8 or 9 since diversification fits my investing style.
These dimensions help show that Graham sits far toward discipline and conservatism. I sit somewhat close to him but with more flexibility for modern businesses.
Question 5:
My overall assessment is that Graham’s approach is still extremely useful. His focus on downside protection, long-term thinking, and conservative financial analysis stands up well even today. The parts I want to incorporate include using long-term earnings records instead of short-term numbers, checking balance sheet strength, and always thinking about the margin of safety. The part I would modify is being more open to high-quality, asset-light companies whose value comes from things like brand, network effects, or intellectual property. Those types of companies did not exist in his era in the same way, so I want to combine his discipline with a more modern understanding of competitive advantages.
Question 6: SEB – Qualitative and Quantitative Analysis
One security that I believe Graham would view as having a solid margin of safety today is Seaboard Corp. (SEB). SEB is an underfollowed conglomerate operating in several basic industries, including pork production, shipping, commodity trading, milling, and power. None of these are high-visibility sectors, and the company does very little investor promotion. This fits Graham’s belief that many real bargains come from quiet, steady companies that the market simply ignores. SEB also has a long record of conservative management and maintains a diversified group of essential businesses with tangible assets.
On the quantitative side, SEB trades at a P/E of about 9.7, which is low for a company with consistent profitability. The stock also trades at about 0.8 times book value, even though its Book Value Per Share is around 5184, which is higher than the current share price near 4184. The balance sheet is conservative, with a debt-to-equity ratio of only 0.36, which is in line with Graham’s preference for low leverage. The company generates positive earnings every year, and over time it has also produced meaningful free cash flow even though the most recent FCF yield is about 4 percent. The mix of steady earnings, tangible assets, and a valuation below book value suggests that the stock is priced with conservative assumptions already reflected in it.
Putting everything together, SEB appears to trade below what a cautious investor might consider its intrinsic value, while also offering stability and conservative financial management. This combination matches Graham’s idea of a margin of safety, and I believe he would consider this type of opportunity attractive.
Question 1:
Benjamin Graham advises that when comparing companies in the same industry, investors should focus on fundamental measures of earning power, financial strength, and intrinsic value. Graham recommends atleast five year averages alongside the most recent 12 month results. This smooths out cyclical or abnormal conditions (like the depressed business climate of 1938) and avoids over emphasis on one year’s data. Ideally use Use standardized forms, multi year averages, and a broad set of financial indicators like the below
• Earnings relative to market price of common stock
• Earnings on total capitalization
• Ratio of gross to market value of common
• Profit margins
• Depreciation relative to plant account
• Working capital position
• Tangible asset values
• Dividend return
• Trend of earnings
Question 2:
Statistical Superiority ≠ Investment Superiority :
Even if one company (Continental) shows better figures across earnings, margins, assets, and dividends, Graham warns that comparisons are only statistical exhibits.They don’t guarantee future performance or eliminate business risk.
Variations in Homogeneity :
The reliability of comparisons depends on how homogeneous the companies are. Even within the same industry (e.g., steel), differences in capitalization structure, product mix, or reporting methods can weaken the validity of side by side tabulations.
Heterogeneous Groups:
Industries where companies respond differently to new conditions, often prospering at each other’s expense. In these groups, comparisons are much less reliable because relative standings shift frequently. In heterogeneous industries, past numbers are less predictive, since competitive shifts and branding can radically alter relative performance.
Question 3:
Graham’s playbook is about systematically hunting mispricing with conservative assumptions and repeatable filters. He focuses on Net-nets and asset bargains i.e Stocks trading below net current asset value (NCAV) or below conservative liquidation value. He looks for Stability i.e 10-year earnings history with no large losses, and stable dividend history. Finally, Margin of safety i.e big discount to conservative intrinsic value
Markets today are shaped less by hard assets on balance sheets and more by intangible drivers—software, data, brands, networks, and customer relationships—that don’t neatly appear as book value. Faster capital cycles mean advantages can emerge and erode quickly. Idea is on preserving his core—margin of safety, disciplined underwriting, absolute-return focus—while upgrading the toolkit to measure intangibles, cash flows, and competitive durability, and to react thoughtfully to quicker industry shifts.
Question 4:
Graham was
• conservative,
• quantitative with Deep intensive analysis of many aspects,
• diversified, and
• focused on margin of safety & liquidation values
My preferred style would be more growth-aware, while still keeping Graham’s discipline on fundamentals and risk control.
The key difference (at the risk of oversimplification would be) : Graham sought cheapness and safety, whereas I’d tilt toward quality and compounding.
Question 5:
Graham’s approach is a masterclass in risk-aware, fundamentals-driven investing. I’d keep his margin of safety, discipline (rigour?), and absolute-return mindset, but layer in quality, selective concentration, scenario-based valuation to capture more durable compounding without sacrificing downside protection. Easier said than done.
His approach excels at protecting capital, exploiting mispricings, and delivering steady returns. The trade-off could be that it can miss exceptional compounding from high-quality growth businesses and often underweights qualitative drivers—management quality, moats, industry dynamics—when they aren’t immediately visible on the balance sheet.
Question 6:
COAL INDIA appears as a Graham style opportunity. Good margin of safety in Net curret asset value, Minimal debt and strong dividend payouts, Tangible asset backing from coal reserves and infrastructure with a power hungry economy. Will have to do a detailed qualitative and quantitative analysis